Explore Waves and Conditions
Explore Waves and Conditions
import numpy as np
import pandas as pd
import matplotlib.pyplot as plt
import seaborn as sns
plt.rcParams["figure.figsize"] = (14, 7)
df = pd.read_csv("covid_victim.csv").assign(is_70_plus=lambda df: df["age"] >= 70)
cond_cols = df.columns[df.columns.str.startswith("condition")]
mean_cols = [
    "positive_rate",
    "total_vaccinations",
    "people_vaccinated",
    "people_fully_vaccinated",
    "total_boosters",
]
sum_cols = [*cond_cols, "is_70_plus", "is_male"]
aggs = {
    **{c: "sum" for c in sum_cols},
    **{c: "mean" for c in mean_cols},
    "count": "sum",
}
MIN_ASC = 30
def get_wave_n(df):
wave_ascents = df.groupby("stage")["climb"].mean().loc[lambda s: s > 40].index
_dic = {a: i + 1 for i, a in enumerate(wave_ascents)}
wave_dic = {**_dic, **{k + 1: v for k, v in _dic.items()}}
subseq_waves = pd.Series([wave_dic.get(e, 0) for e in df["stage"]], index=df.index)
return np.where(
df["climb"].abs().rolling(4).mean() > (MIN_ASC / 2), subseq_waves, 0
).astype(str)
weekly_wave_df = (
df.assign(count=1, pdate=pd.to_datetime(df["estimated_date"]))
.groupby("pdate")
.agg(aggs)
.resample("1W")
.agg(aggs)
.assign(
climb=lambda df: df["count"].diff(),
stage=lambda df: (df["climb"] > MIN_ASC)
.diff()
.pipe(lambda s: s & (s != s.shift(1)) & (s != s.shift(2)))
.fillna(0)
.astype(int)
.cumsum(),
wave=get_wave_n,
wave_stage=lambda df: np.where(
df.groupby("stage")["climb"].transform("mean") > 0, "ascent", "descent"
),
)
.loc[lambda df: df["wave"] != "0"]
)
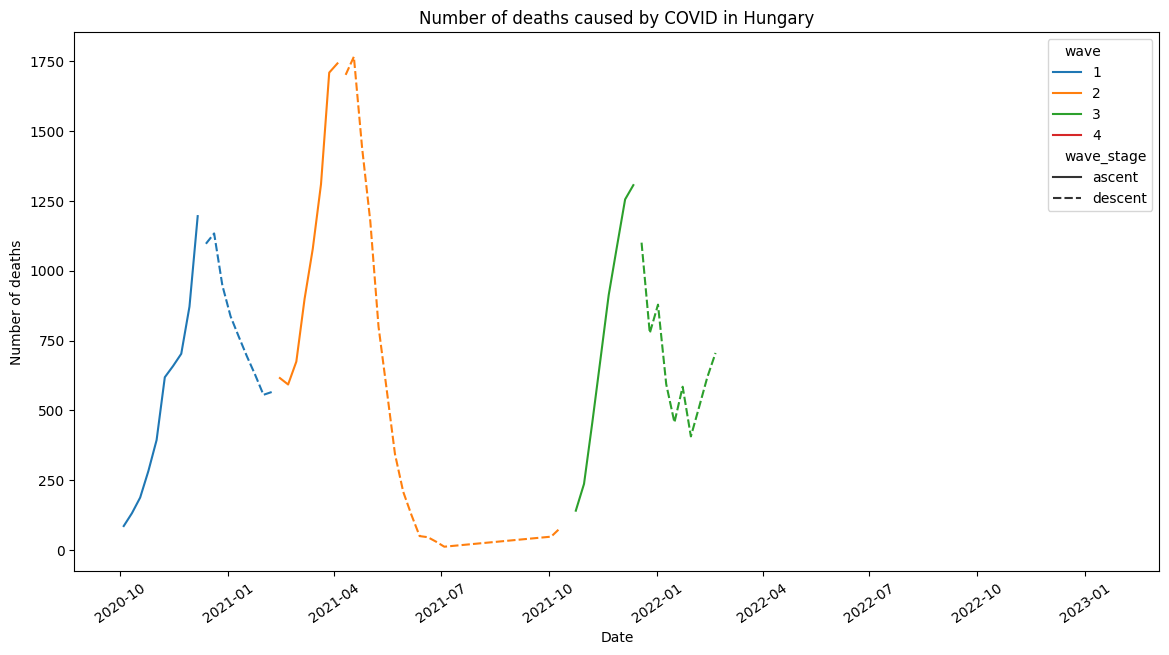
ax = weekly_wave_df.reset_index().pipe(
lambda df: sns.lineplot(
x="pdate", y="count", hue="wave", style="wave_stage", data=df
)
)
plt.title("Number of deaths caused by COVID in Hungary")
plt.xlabel("Date")
plt.xticks(rotation = 35)
plt.ylabel("Number of deaths")
plt.show()
changes = (
    weekly_wave_df.loc[:, ["count", *sum_cols]]
    .pipe(lambda df: 2 * df.diff() / (df + df.shift()))
    .fillna(0)
    .pipe(lambda df: df - df[["count"]].values)
    .drop("count", axis=1)
)
(
    pd.concat([changes, weekly_wave_df[["wave", "wave_stage"]]], axis=1)
    .pivot_table(index=["wave", "wave_stage"], values=sum_cols)
    .rename(columns=lambda s: s.replace("condition__", ""))
    .style.background_gradient(
        axis=None,
        vmin=-0.1,
        vmax=0.1,
        cmap=sns.diverging_palette(
            220,
            20,
            as_cmap=True,
        ),
    )
    .set_caption("Growth of conditions compared to the growth of deceased people (%)")
)
| blood_pressure | diabetes | heart | lungs | obesity | is_70_plus | is_male | ||
|---|---|---|---|---|---|---|---|---|
| wave | wave_stage | |||||||
| 1 | ascent | -0.002730 | 0.004524 | 0.037673 | 0.000211 | -0.009186 | 0.004350 | -0.008984 |
| descent | 0.006674 | 0.000927 | 0.019730 | 0.018787 | 0.040337 | -0.000514 | -0.004357 | |
| 2 | ascent | 0.000394 | 0.002414 | -0.049256 | -0.053962 | 0.119785 | -0.021713 | 0.011351 |
| descent | -0.006851 | 0.024578 | -0.024435 | 0.051909 | -0.025324 | -0.001743 | 0.007955 | |
| 3 | ascent | -0.010319 | -0.055158 | 0.024522 | -0.010020 | -0.055266 | 0.012735 | -0.016413 |
| descent | 0.007315 | 0.001789 | 0.025949 | -0.000337 | -0.048794 | 0.017995 | -0.005324 | |
| 4 | ascent | 0.007603 | -0.066693 | 0.033743 | 0.000125 | -0.337224 | 0.045969 | 0.035116 |
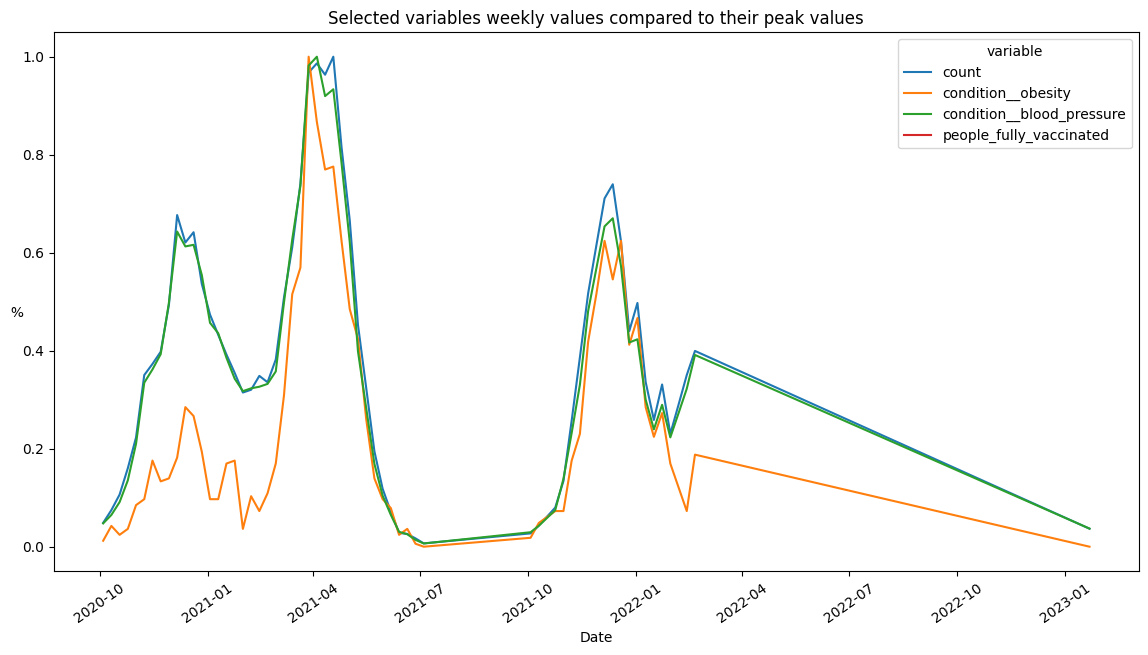
ax = weekly_wave_df.loc[
    :,
    [
        "count",
        "condition__obesity",
        "condition__blood_pressure",
        "people_fully_vaccinated",
    ],
].pipe(lambda df: df / df.max()).melt(ignore_index=False).reset_index().pipe(
    lambda df: sns.lineplot(x="pdate", y="value", hue="variable", data=df)
)

plt.title("Selected variables weekly values compared to their peak values")
plt.xlabel("Date")
plt.xticks(rotation = 35)
plt.ylabel("%", rotation = 180)
plt.show()
condition_counts = (
    pd.DataFrame(df["raw_conditions"].str.split(", ").tolist())
    .unstack()
    .dropna()
    .value_counts()
)
df_contition_counts = pd.DataFrame(condition_counts.head(20), columns = ['Count'])
df_contition_counts.index.name= 'Conditions'
df_contition_counts.style.set_caption("Top 20 conditions recorded for the deceased")
| Count | |
|---|---|
| Conditions | |
| magasvérnyomás-betegség | 20589 |
| cukorbetegség | 12810 |
| magas vérnyomás | 8889 |
| iszkémiás szívbetegség | 4860 |
| szívbetegség | 3614 |
| demencia | 3022 |
| daganatos megbetegedés | 2798 |
| krónikus veseelégtelenség | 2299 |
| szívelégtelenség | 2224 |
| veseelégtelenség | 1952 |
| nem ismert alapbetegség | 1950 |
| szívritmuszavar | 1890 |
| tüdőbetegség | 1874 |
| érelmeszesedés | 1478 |
| pitvarfibrilláció | 1438 |
| vérszegénység | 1406 |
| kóros elhízás | 1392 |
| krónikus obstruktív tüdőbetegség | 1379 |
| elhízás | 1124 |
| asztma | 1110 |